You are here

News

06/03/2016

AirGravity Science element: 

With good weather last week, OMG’s AirGravity contractor (Sander, or SGL) deployed to their new location (Kulusuk)  on the South East side of Greenland, and flew 1 science day last week.  SGL flew for a total of 9.5 flight hours. 

Images from South Eastern Greenland, SGL's GPS station, near Kulusuk

05/13/2016

The Airborne Snow Observatory in Mammoth Lakes, CA completed a survey of Tuolumne Basin on May 9. Processing for that flight is underway. The processed data and snow products for the Conejos basin in CO were delivered to the Colorado Water Conservation Board and will be utilized in long term water forecasting.

05/13/2016

AirGravity Science element:  With reasonable weather last week, OMG’s AirGravity contractor (Sander or SGL) flew 15 OMG flight lines, for a total of 25 flight hours. 

05/05/2016

Last week, with reasonable weather, OMG’s AirGravity contractor (Sander Geophysics Ltd. -  SGL) flew 32 OMG flight lines, for a total of 28 flight hours. The flight track plot below, shows SGL flying over 4,039 kilometers, and completing the Alison and Upernavik survey areas.

OMG’s Western science area, flight track map

Alison Glacier

04/29/2016

Last week, OMG’s AirGravity contractor (SGL) flew six OMG flight lines, for a total of 5.5 flight hours. The flight track plot below, shows SGL completing over 954 kilometers of 5,770 total kilometers planned, or 14 percent of the Cornell survey.

04/18/2016

This past week, the ASO flight team completed surveys in the Rio Grande and Conejos basins in Colorado for the Colorado Water Conservation Board.

The ASO compute team finished processing the April 1 Tuolumne snow data products. It is a great improvement over the past two years of Mega drought conditions. In the image below you can compare the early April Snow Water Equivalent as calculated from ASO measurements in Thousands of Acre-Feed (TAF) over the past 4 years. 

04/11/2016

The L-band radar aboard the Armstrong G-III/C-20A is back in service since March 23.  We’ve been acquiring data in California, including the monthly Sacramento Delta levee monitoring, semi-annual San Andreas Fault monitoring, Baja California fault monitory, and landslide study in Slumgullion, Colorado.  Besides additional local flights for crustal deformation studies, this week we will be conducting three flights over Tuolumne River Basin to study snow accumulation with repeat-pass L-band interferometry.  

04/11/2016

The GLISTIN-A radar aboard the JSC G-III aircraft has completed its two-week Greenland campaign for the Earth Venture Oceans Melting Greenland (OMG) mission.  The Ka-band single-pass interferometer, a sibling instrument of UAVSAR, made high resolution, high precision elevation measurements of Greenland’s coastal glaciers for the spring season.  

04/11/2016

The Airborne Snow Observatory team is in full swing for 2016 snow-melt data collections. The flight team surveyed Olympic National Park last week and has done the first two Tuolumne acquisitions. 

03/21/2016

UAVSAR aboard the NASA502 has successfully completed the Gabon deployment and returned to Palmdale, CA on Sunday, March 13.  In all, we conducted 8 science flights in Gabon for terrestrial ecology study in coordination with Goddard’s LVIS lidar instrument and the European Space Agency’s two airborne radars from Germany and France respectively to support future NASA space missions (NISAR and GEDI).  We also managed to acquire some opportunistic data for wetland delineation over Ogooue River for the NISAR mission science team. 

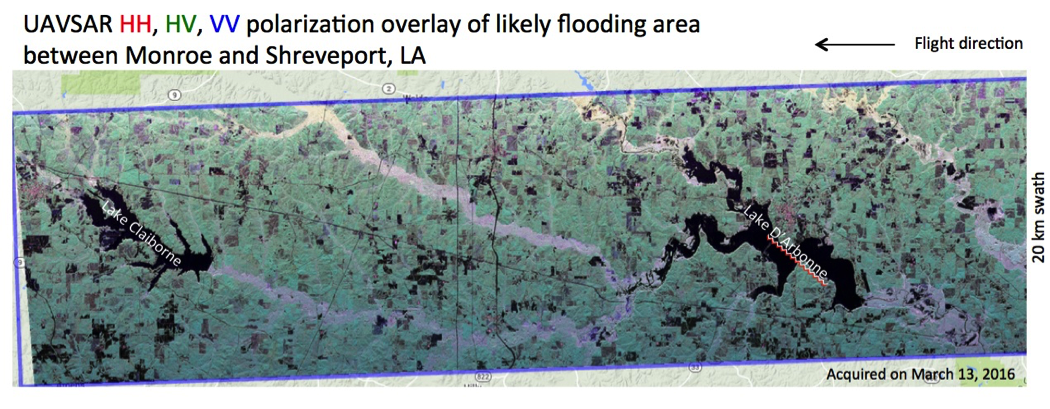
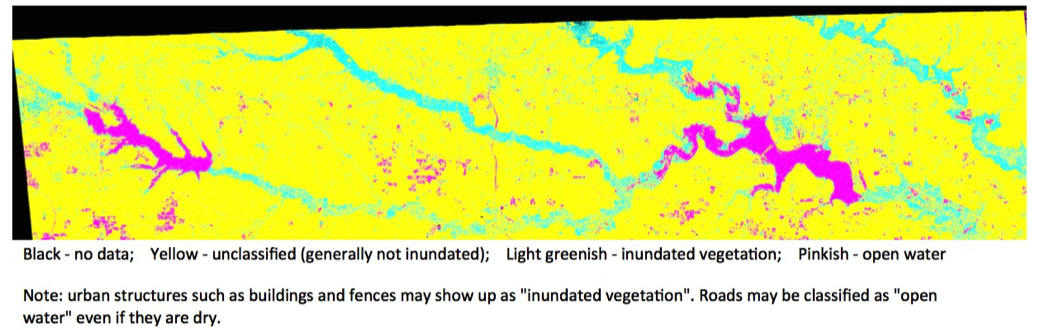
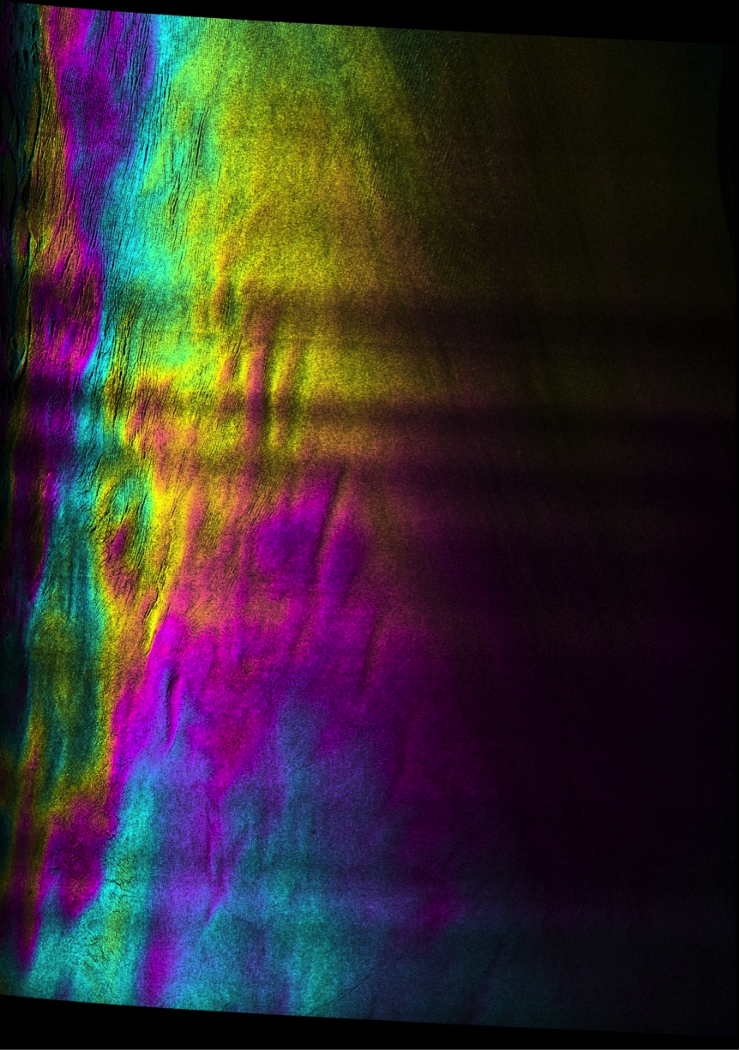
On our transit home through New Orleans, LA, we were requested by NASA HQ to participate in the Gulf Coast flooding emergency response efforts organized by FEMA.  We acquired data around New Orleans as planned (land subsidence study, PI: Cathleen Jones) as well as three flight lines over the likely flooding areas near Monroe and Shreveport, LA and Longview, TX on Sunday afternoon, March 13.  The data were brought back to JPL for immediate processing.  By Monday morning (within 12 hours of landing) we already released polarimetric data of the three flight lines covering the likely flooding areas.  Bruce Chapman then classified the images using polarimetric decomposition technique to identify the inundated vegetation and open water.  These products have been sent to our colleagues at FEMA to assist NGA in their damage assessment efforts for the purpose of recovery assistance.  Here’s an example of the UAVSAR imagery together with the inundation classification map.

Pages