AirMOSS mission reached a significant milestone yesterday as we successfully completed all the P-band radar observations of root zone soil moisture for the entire mission, thus meeting the baseline science requirement for science observations. Over the past 3 years we have conducted 186 science flights over the selected nine biomes in North America during the growth season, which amounted to over 1200 hours including engineering and transit flights. In addition, the Picarro wavelength-scanned cavity ring-down spectrometer onboard the Purdue Airborne Laboratory for Atmospheric Research (ALAR) aircraft flew 86 hours in 2012 and 2013 to measure the spatial variations of atmospheric CO2 fluxes to validate model simulations of Net Ecosystem Exchange based on AirMOSS’ P-band radar root zone soil moisture measurements.
You are here
News
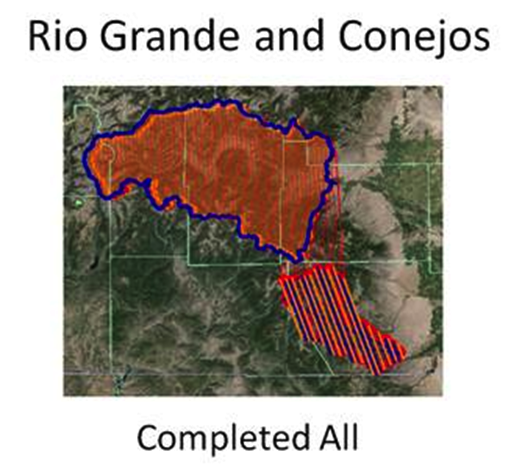
The Airborne Snow Observatory finished up all of our summer Colorado surveys. We’ve flown a total 83.5 flight hours since September 10 and have surveyed the Rio Grande and Conejos basins as well as Ouray and San Miguel counties and large portions of Montrose and San Juan counties. The plane transited to Mammoth Lakes, CA and did a test to determine data quality due to smoke produced by nearby fires and determined the smoke at these levels to be a non-issue. Later this week when the clouds clear up we will start surveying our CA snow-free targets.
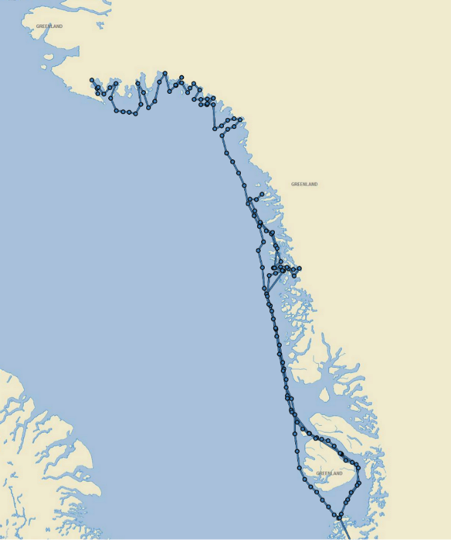
On Monday September 21, OMG's survey ship completed the 2015 Western Greenland survey. The ship surveyed more than 4,250 nautical miles, and acquired more than 300 Conductivity, Temperature Depth (CTD) sonar calibration casts.
The crew returned to Seattle with all the survey data. OMG's raw survey data will be calibrated, NETCDF formatted and the final product sent to JPL by January 15, 2016.
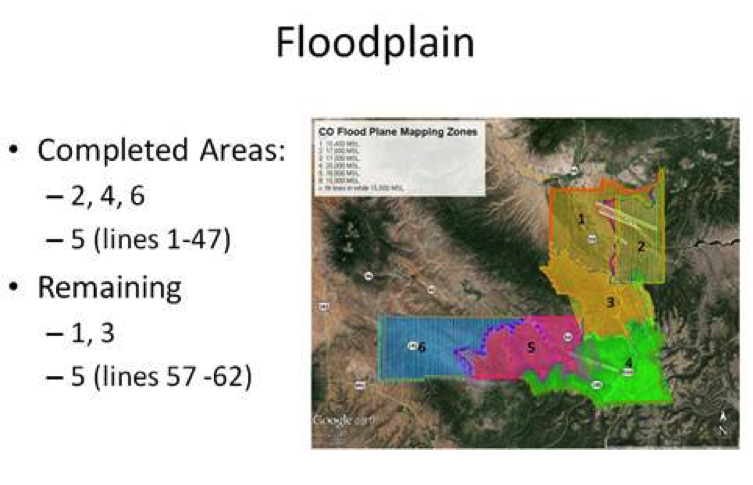
Since the ASO team deployed for summer surveys on September 10 we have covered a lot of survey area. We’ve flown about 56 flight hours, collected data over Devil’s Golf course in CA, Rio Grande and Conejos basins in CO for snow baseline data, and about half of our CO Floodplain mapping areas which include Sam Miguel, Ouray, parts of Montrose and San Juan counties in CO (also includes the Gold King Mine spill area).
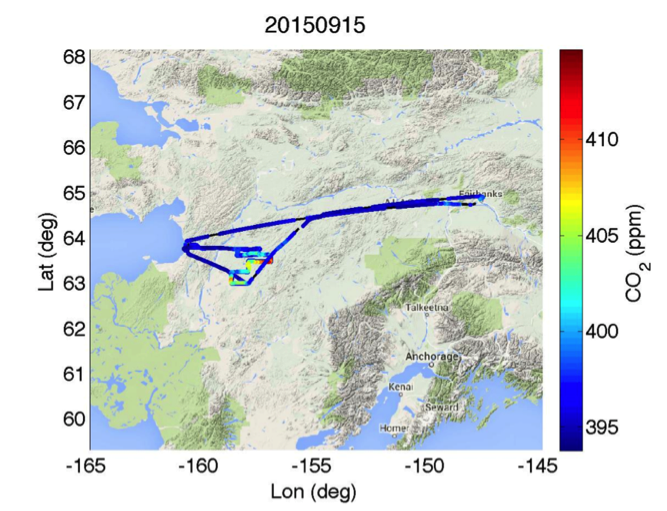
CARVE's last flight for the September campaign was to the Innoko. CARVE observed increased CH4 and CO2.
CARVE wrapped up the successful September campaign with a total of 37 science flight hours in 7 science flight days, BUT the big news is, CARVE since 2012, has flown over 1000 science flight hours with 100 percent dispatch rate with JPL supplied equipment.
Last week, OMG survey ship surveyed 197 nautical miles and supported 11 Conductivity, Temperature, Depth (CTD) profiles.
Below is the Melville Bay, quick look survey plots.
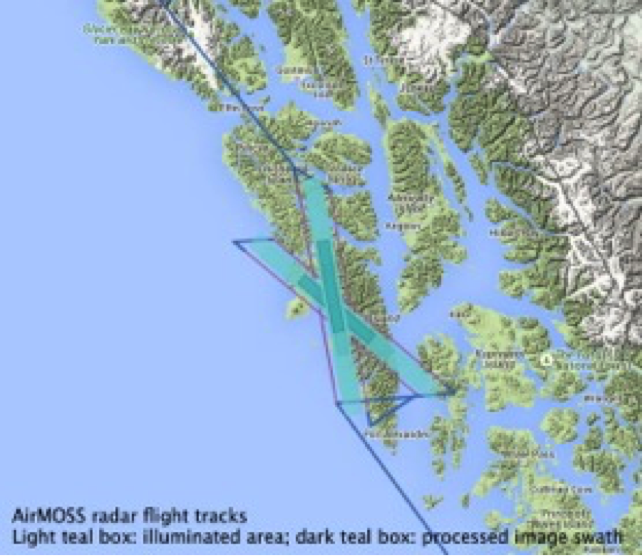
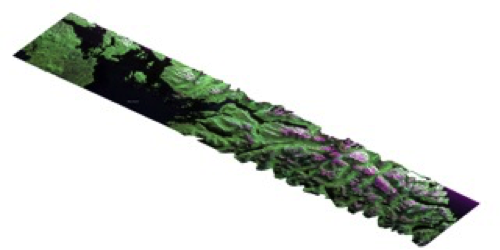
The P-band radar is conducting its last east coast deployment observing Harvard/Howland forests in New England and Duke Forest in North Carolina. JPL's science team members are conducting field measurements at all three biomes with the help of graduate students from UCLA and local schools. At JPL, polarimetric processing of both flight days over the Alaksa Sitka landslide area has been completed. Attached is a three-polarization color composite of one transect over Baranof Island and Sitka Sound. Repeat-pass interferometric processing will follow this week.
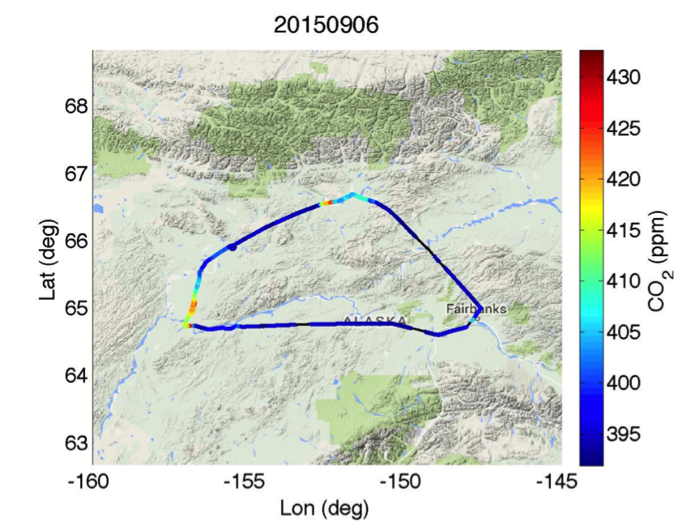
On September 6 flight (Fairbanks to Bettles in the North, and Galena to the West), shows elevated CO2 near Bettles and Galena.
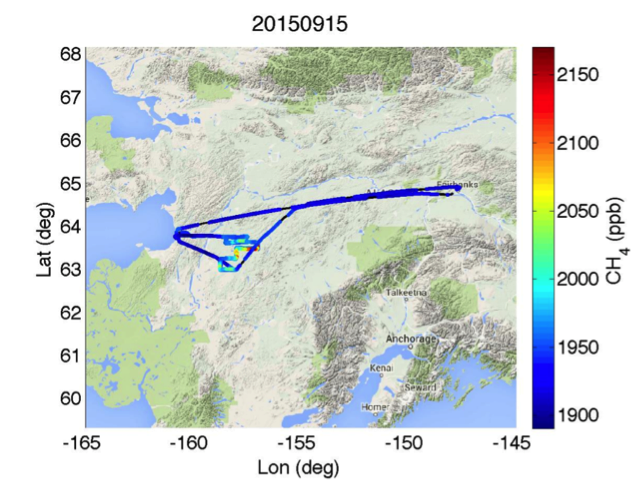
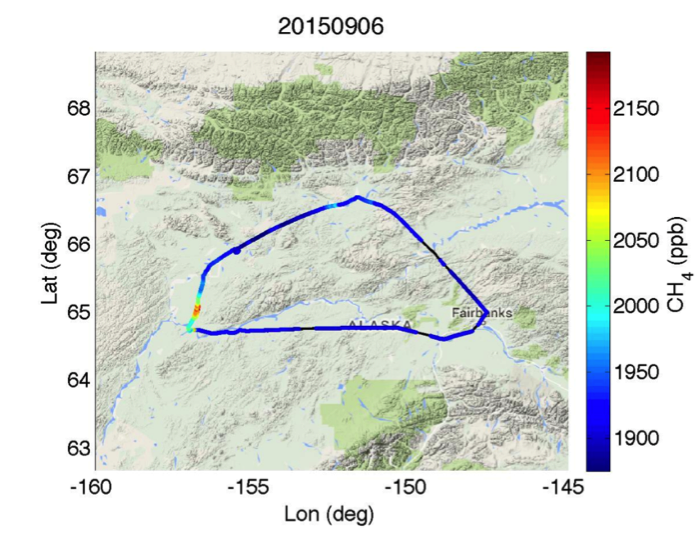
The CH4 plot below shows elevated CH4 only near Galena for the same flight day.
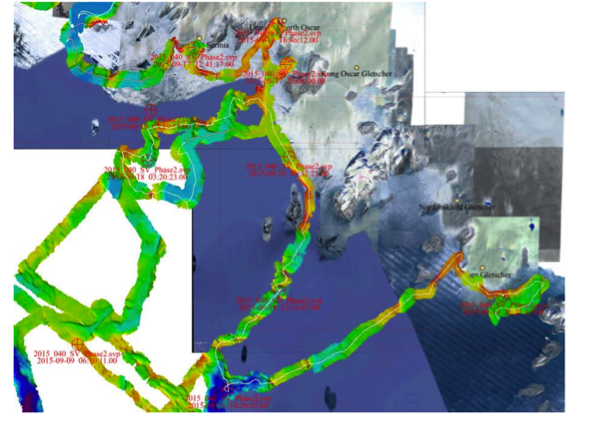
September 6, the OMG's Bathymetry sonar survey ship surveyed 416 nautical miles, with 15 Conductivity Temperature, Depth (CTD) measurements.
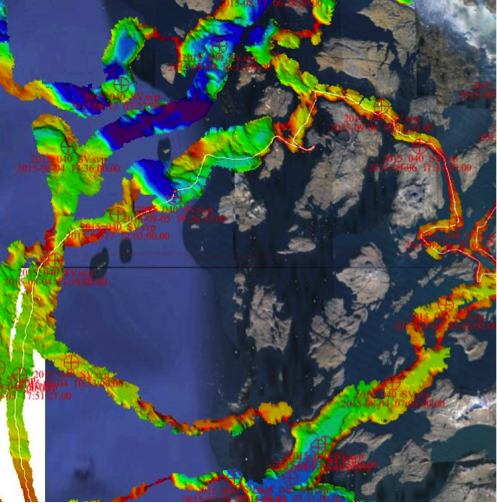
The thin yellow line is the ship track, going into Kakivfaat bay. While the ship was in the bay, the glacier calved while the ship was stopped taking a CTD measurements. The ship was approximately 1.0 nautical mile from the glacier face.
The P-band radar completed the Alaska permafrost observation last weekend. In addition, the radar made two observations over the Sitka landslide area in the southeastern tip of Alaska on August 28 and 31 respectively. The crossing flight lines are shown in the graphics below and we will attempt to reconstruct the 3-dimensional deformation signals from interferometric data sets acquired 3 days apart. Repeat-pass interferometry with the P-band radar has recently been demonstrated with data acquired in Harvard Forest. In addition, polarimetric data products can be used to detect geophysical changes in the forest landscape such as landslides and rotation of forest stands.