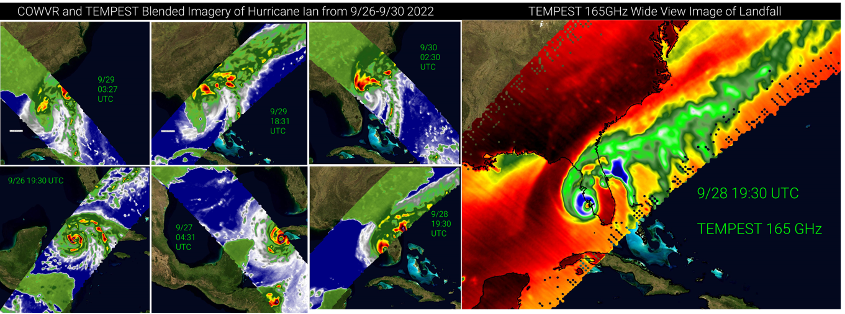
COWVR and TEMPEST observe Hurricane Ian’s development and landfall(s). The left panels show blended radiances from COWVR and TEMPEST. The blue areas are generally clear air over the ocean. The transition from white to green shows increasing liquid water content in the form of clouds and rain. The most intense convective precipitation is illustrated by the yellow to red to black transition. Ian becomes more disorganized as it traversed Florida, but started to reform an eye after making it back into the Atlantic. The radiance data from only TEMPEST are shown in the right panel giving a wider view during landfall on 9/28. TEMPEST has a 1400km swath compared to COWVR’s 900km swath (which is depicted in the blended imagery). The right panel uses a different color scheme. Here, the dark red colors wrapping around the storm in the Gulf of Mexico show water vapor being pulled into the storm, whereas the most intense precipitation is denoted by the blue colors around the eye wall and just off the east coast of Florida. The green colors extending up the Eastern seaboard are from ice aloft in the outflow cloud field extending away from the storm.
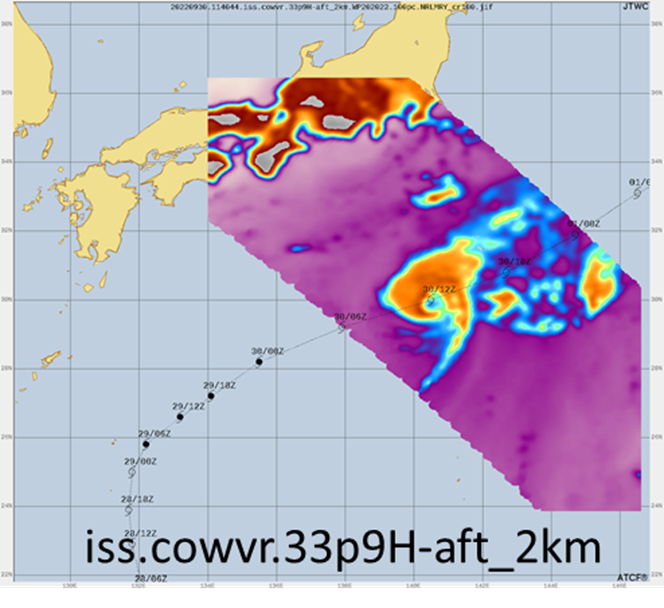
The Joint Typhon Warning Center (JTWC) used live COWVR and TEMPEST data to generate a forecast advisory on 10/2/2022 for Tropical Storm “Roke” in the western Pacific. JTWC forecaster stated, “Great stuff guys! First batch of "realtime" COWVR and TEMPEST data for a "live" storm in ATCF. It looks great and will certainly be a valuable addition to the analysis quiver going forward.” The image below shows one of the COWVR images used by the forecasters. In this image, COWVR data provide a fix on the storm circulation center which is used in the forecast for the future track of the storm, shown as the faint black line.