You are here

News

03/01/2023

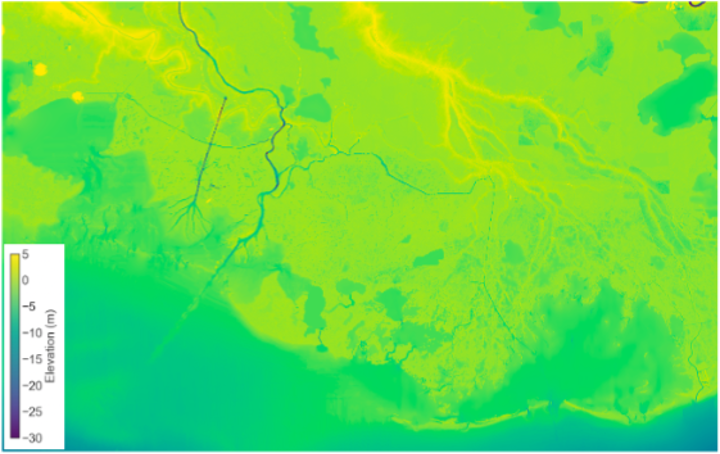
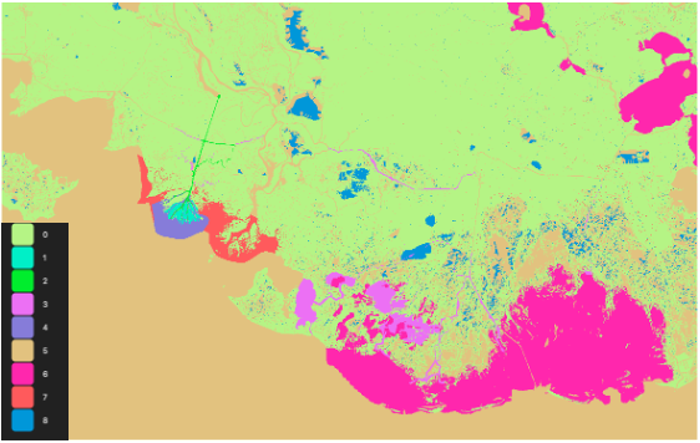
Delta-X delivered its first Level 4 product, Map of bathymetry/elevation data, on Feb 27, 2023. Figure 1 shows the merged elevation map while figure 2 shows the primary data source for each pixel. The elevation data was merged from 8 sources listed below.


Figure 1. Delta-X merged elevation map


Figure 2. Primary data source for each pixel in the merged elevation map

0: Topography from USGS
1: Topography from NCALM
2: Bathymetry from Pre-Delta-X Sonar
3: Bathymetry from Delta-X Sonar
4: Bathymetry from Shaw
5: Bathymetry from NOAA2011/CoNED
6: Bathymetry from CPRA
7: Bathymetry from ADH
8: Synthetic Bathymetry (carved to -2 m in waterbodies larger than 1 Ha where no other bathymetry data was available)

12/15/2022

The UAVSAR-Ka topographic InSAR (a.k.a. GLISTIN-A) aboard the AFRC C-20 jet successfully completed the week-long Mauna Loa volcano rapid response deployment (PI: Paul Lundgren).  We conducted 3 flights over the active lava flow as well as mapped the topography of both Mauna Loa and Kilauea volcanos.  The SAR-Fusion Optical/SWIR cameras (PI: Andrea Donnellan) were also onboard to take coincident imagery for generating high resolution Digital Elevation Model (DEM) for comparison with the GLISTIN-A DEM.

On December 7 (Wednesday), we imaged the Mauna Loa volcano in its entirety and repeated the flight lines over the active lava flow at the end of the flight to see if we are able to detect lava thickness changes after two hours.  UAVSAR Science Coordinator Naiara Pinto brought the raw radar and optical data back to Pasadena via commercial air on Wednesday night for rapid processing.  We were able to deliver preliminary DEM by Friday morning to Paul Lundgren and his colleague Hannah Dietterich at Alaska Volcano Observatory of USGS, approximately 1 day after receipt of the raw data.

The USGS/HVO team was able to compare the GLISTIN-A DEM to their baseline DEM from 2005 to quickly determine the change in lava thickness and lava volume for eruption response (see Figure 1).  Dr. Dietterich and her team are updating their lava flow forecasting models and tracking eruption rates in support of Civil Defense, HI emergency management agency to prepare for the potential of the lava flow reaching and burying the highway between Kona and Hilo.  Fortunately, the eruption rates have slowed significantly by the second day of our deployment and the highway was no longer in threat.

The second figure is the lava flow thickness generated by Paul Lundgren by comparing GLISTIN-A DEM to TanDEM-X DEM (data acquired between 2010-2015), showing lava flow thickness in excess of 20 m at the lava fronts. 
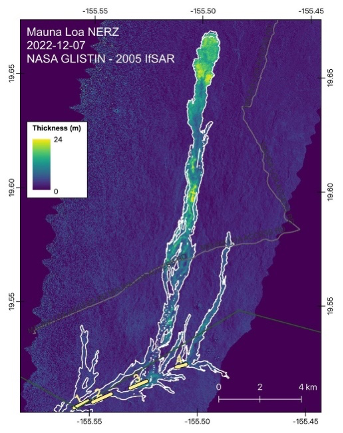

The USGS/HVO team was able to compare the GLISTIN-A DEM to their baseline DEM from 2005 to quickly
determine the change in lava thickness and lava volume for eruption response
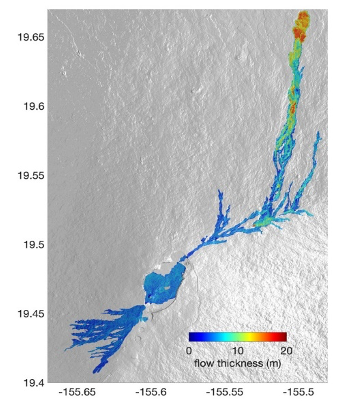


lava flow thickness generated by Paul Lundgren by comparing GLISTIN-A DEM to TanDEM-X DEM (data acquired
between 2010-2015), showing lava flow thickness in excess of 20 m at the lava fronts.
10/06/2022

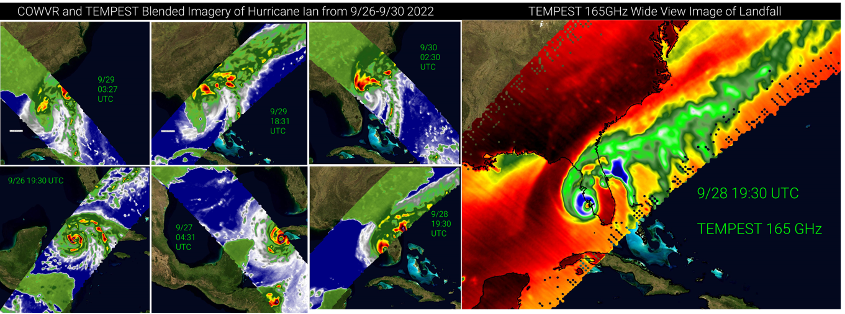
COWVR and TEMPEST observe Hurricane Ian’s development and landfall(s).  The left panels show blended radiances from COWVR and TEMPEST.  The blue areas are generally clear air over the ocean.  The transition from white to green shows increasing liquid water content in the form of clouds and rain.  The most intense convective precipitation is illustrated by the yellow to red to black transition. Ian becomes more disorganized as it traversed Florida, but started to reform an eye after making it back into the Atlantic.  The radiance data from only TEMPEST are shown in the right panel giving a wider view during landfall on 9/28.  TEMPEST has a 1400km swath compared to COWVR’s 900km swath (which is depicted in the blended imagery). The right panel uses a different color scheme. Here, the dark red colors wrapping around the storm in the Gulf of Mexico show water vapor being pulled into the storm, whereas the most intense precipitation is denoted by the blue colors around the eye wall and just off the east coast of Florida. The green colors extending up the Eastern seaboard are from ice aloft in the outflow cloud field extending away from the storm.

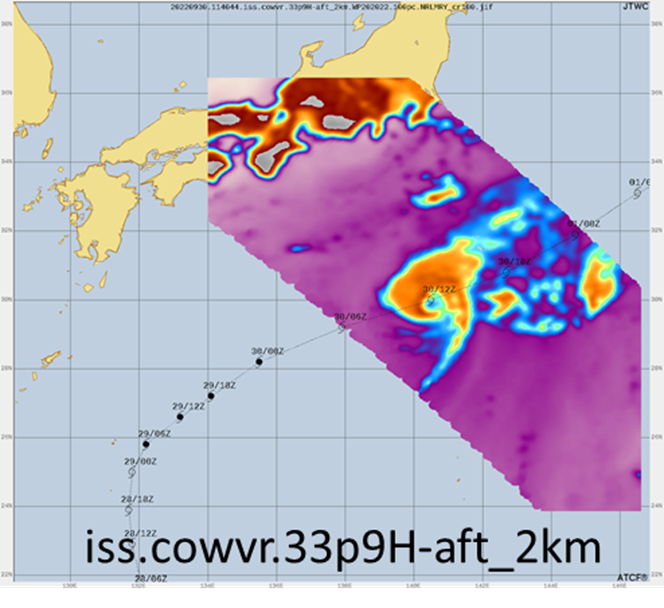
The Joint Typhon Warning Center (JTWC) used live COWVR and TEMPEST data to generate a forecast advisory on 10/2/2022 for Tropical Storm “Roke” in the western Pacific.  JTWC forecaster stated, “Great stuff guys! First batch of "realtime" COWVR and TEMPEST data for a "live" storm in ATCF. It looks great and will certainly be a valuable addition to the analysis quiver going forward.”  The image below shows one of the COWVR images used by the forecasters.  In this image, COWVR data provide a fix on the storm circulation center which is used in the forecast for the future track of the storm, shown as the faint black line.

09/01/2022

The 2022 SoOpSAR/King Air mission was successful completed on Aug 26 with all objectives achieved: testing the performance of SoOpSAR instrument, understanding the radio frequency interference environment, and collecting quality science data with tight flight lines of 10 m spacing.

08/18/2022

The L-band radar aboard the AFRC C-20 jet (NASA802) embarked on the 2022 Arctic-Boreal Vulnerability Experiment (ABoVE) campaign in Canada and Alaska on Friday, 12 August.  ABoVE is a large-scale study of environmental change and its implications for social-ecological systems and include multiple airborne and field teams during the campaign.  First stop for UAVSAR was Saskatoon, Canada, where we conducted a TomoSAR experiment over the Boreal Ecosystem Research and Monitoring Sites (BERMS) in northern Saskatchewan Province.  These TomoSAR flight lines were also extended by 20 km to cover the SMAPVEX sites in BERMS.   A quick look polarimetric color composite image over the BERMS TomoSAR site is attached, where it shows the complexity of the boreal forests of different species and status.

06/29/2022

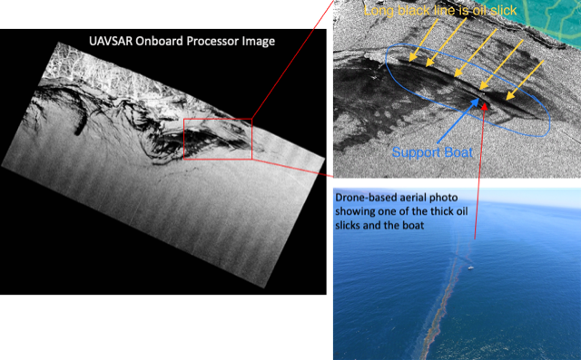
The L-band radar began its Santa Barbara Oil Seep experiment aboard the AFRC jet (NASA802) on June 24, 2022, for observing natural seeps near Santa Barbara shoreline in coordination with the in-situ teams as well as satellite imagery from Radarsat-2, TerraSAR-X, and Worldview.  On June 24, surface team reported lots of different oil slick configurations with variant wind conditions, which were captured by UAVSAR successfully.  Attached is a UAVSAR onboard processor quicklook image showing the oil slicks and support boat across one of the thick slick, as well as the aerial photo of the same slick.

11/04/2021

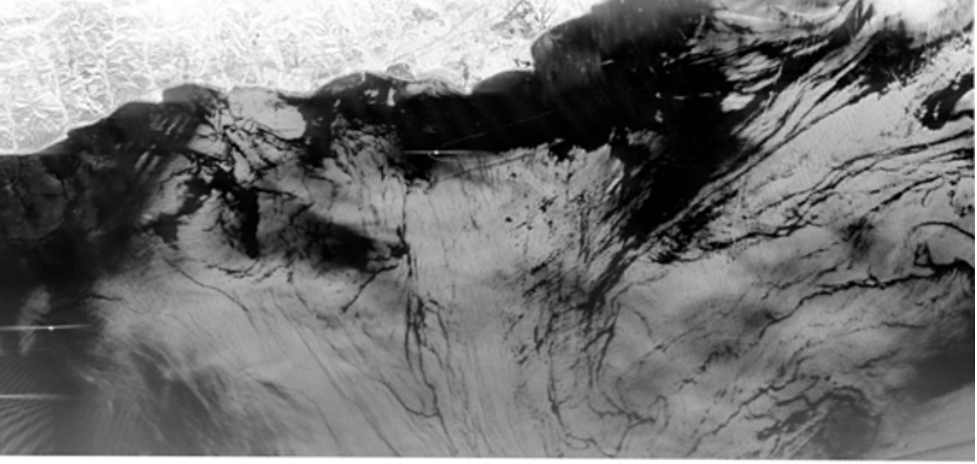
The L-band radar aboard the AFRC C-20 jet successfully completed the Santa Barbara Oil Slick experiment (PI: Frank Monaldo) last week.  In coordination with NOAA, JPL, and the US Coast Guard, the experimenters are studying the use of L-band polarimetric SAR data to determine oil thickness, and practicing the workflow for disaster response.   We imaged the natural oil seepage in the Santa Barbara Channel 3 days in a row in coordination with a US Coast Guard ship collecting in-situ data and the L-band radar saw many oil slicks over the ocean surface, as shown in the image below.  


The dark areas in this VV polarization image are oil slicks.

09/30/2021

Delta-X officially concluded its fall campaign on Saturday, 25 September! Boston University’s Water Quality team took their last water sample on 24 September while AVIRIS-NG imaged the area for post Hurricane Ida assessment (as part of an R&D task). The JPL and UNC teams retrieved most of the water level gauges within the channels and a few located in the wetlands of the Atchafalaya river. The LSU team will retrieve a few more gauges located at the intensive sites during its regular (every ~6 months) soil accretion surveys that will continue over the next 2 years.

09/30/2021

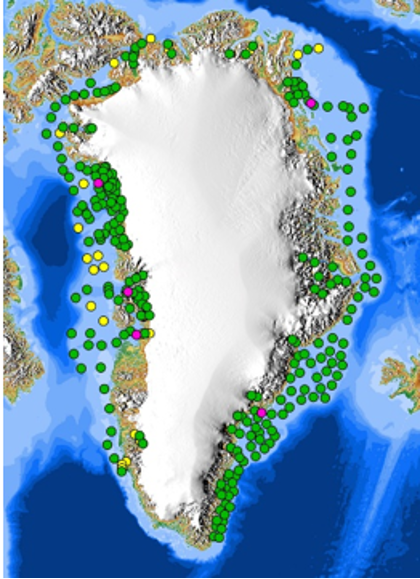
The NASA Earth Venture Suborbital 2 Oceans Melting Greenland (OMG) completed the sixth and final Airborne Oceanographic Survey in Greenland on 22 September.   A total of 350 temperature and salinity dropsondes were deployed on the continental shelf around Greenland from the JPL subcontracted DC3 Turbo Prop Aircraft from Kenn Borek Air, LTD of Calgary, Canada.  In addition to the dropsondes, a total of 18 robotic satellite based drifter and floats were deployed from the open door of the aircraft, and provide months to years of data of temperature and salinity.


Map showing all of the locations that dropsondes were deployed in green, and floats
and drifters in purple, and a few yellow locations were floats were planned but not deployed.

The final week of the OMG 2021 campaign was a coordinated outreach effort between NASA, the US State Department and the Greenlandic Government. There was a number of science outreach programs with the OMG team at local Greenland High Schools, including aircraft tours. Additionally, there was a number of VIP flights for the Greenlandic Government and Research community and the US State Department. The outreach effort by the OMG team was well received by the Greenland officials. 

09/23/2021

The Delta-X JPL and UNC ADCP teams returned to the Mississippi Delta on Monday, 20 September to retrieve water level gauges. They plan to stay until Sunday, 26 September. The Boston University Water Quality team has been collecting data over the past week and plans to return on Friday, 24 September. Water Quality team members on an airboat operating a Portable SpectroRadiometer (PSR) that measures above-water surface reflectance, an in-situ field measurement analogous to the imagery that AVIRIS-NG produces.

Pages